Definitions
Priority metrics have plain-English meanings, inclusions, exclusions, and safe-use notes.
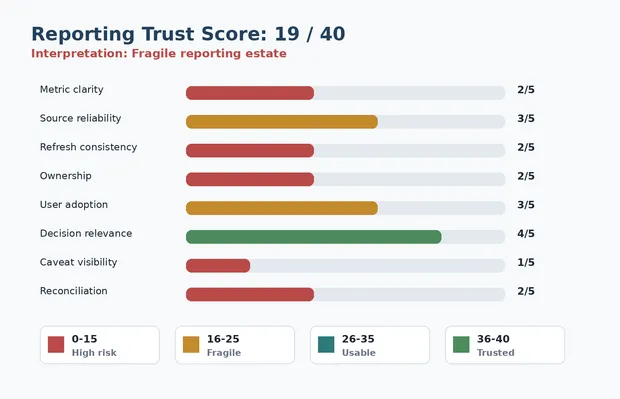
Reporting Trust Scorecard
A first-pass assessment for reports people keep debating
Use this scorecard to inspect one disputed metric, dashboard, spreadsheet, or finance pack before commissioning another report. It helps you spot whether the problem is meaning, ownership, source path, caveats, duplication, or automation risk.
When to use it
The scorecard is for problem-aware readers who know something is wrong but do not yet know where to inspect. It deliberately stays lightweight so it does not replace the deeper workbook and planning assets in the Reporting Blueprint Toolkit.
Six dimensions
Priority metrics have plain-English meanings, inclusions, exclusions, and safe-use notes.
Business and technical owners are named, active, and able to approve changes.
Important numbers can be traced from source system to report without relying on memory.
Users can see timing rules, freshness, known limits, and approval status before acting.
Duplicate dashboards, shadow reports, and ownerless versions are visible and managed.
Automated summaries and AI workflows use only metrics with enough trusted context.
How to score
Give each dimension a score from 0 to 2. A low score is not a failure; it is a signal about where trust is breaking. The practical question is which weak point creates the most decision drag.
First pass
Choose one important metric or report that creates recurring disagreement.
Score each dimension as 0, 1, or 2 based on the evidence you can see today.
Look for the lowest-scoring dimension before asking for another dashboard.
Use the result to decide whether the next move is definition, ownership, lineage, caveat, cleanup, or automation control.
Interpretation
The score is not a grade. It is a way to make the weak point visible enough that the next conversation becomes specific. A low definition score needs a meaning conversation. A low lineage score needs a source path conversation. A low caveats score needs a safe-use conversation.
The metric is likely dependent on local knowledge, manual checks, or one person's explanation.
Some trust signals exist, but the weakest dimension is still creating decision drag.
The number can support decisions in the right context, but caveats and ownership still matter.
The metric has enough visible context to be used confidently for its intended decision.
Lowest score
The most useful output is usually not the total. It is the lowest dimension score. Use that weak point to decide which conversation should happen next, then use the related guide for more context.
Pause the report debate and agree what the metric means, where it is safe to use, and which variants need separate labels.
Read the KPI definition guideName the business owner for meaning and the technical owner for the reporting path before changing the dashboard.
Read about reporting contractsTrace where the number starts, where it changes, and where manual logic enters before comparing final outputs.
Read the lineage guideMake timing rules, freshness, exclusions, and approval status visible so people know when the number is safe to use.
Read the reconciliation checklistIdentify duplicate dashboards, shadow spreadsheets, and ownerless versions before deciding which view is authoritative.
Read about dashboard sprawlDo not let summaries, copilots, or automated workflows reuse numbers that lack enough trusted context.
Read the AI readiness guideMeeting use
The scorecard works best when the business is stuck debating a number and needs a narrower next step. Keep the scope to one metric, one decision, and one trust gap.
Pick one disputed metric and score it privately against the six dimensions. Bring evidence, not a long audit.
Share the lowest score first. Keep the conversation on the missing trust signal rather than the whole reporting estate.
Agree one next action: clarify meaning, name an owner, trace the path, expose caveats, retire duplicates, or pause automation.
Next step
The free chapter explains why reporting trust breaks before more dashboards, automation, or AI can fix it.