Article
A Data Role Is a Centre of Gravity, Not a Box
Data job titles look categorical. The work rarely is.
A title may point in the right direction while still hiding whether a role is mainly about platform operations, data modelling, dashboard delivery, decision support or some combination of them.
I have spent more than ten years working across data and analytics. In that time, I have seen apparently similar titles describe materially different jobs, and different titles describe almost the same work.
My view is that a data role makes more sense as a centre of gravity across a shared work stack than as a box with hard borders.
The title is shorthand. The responsibility profile is the role.
The detailed role-by-responsibility map
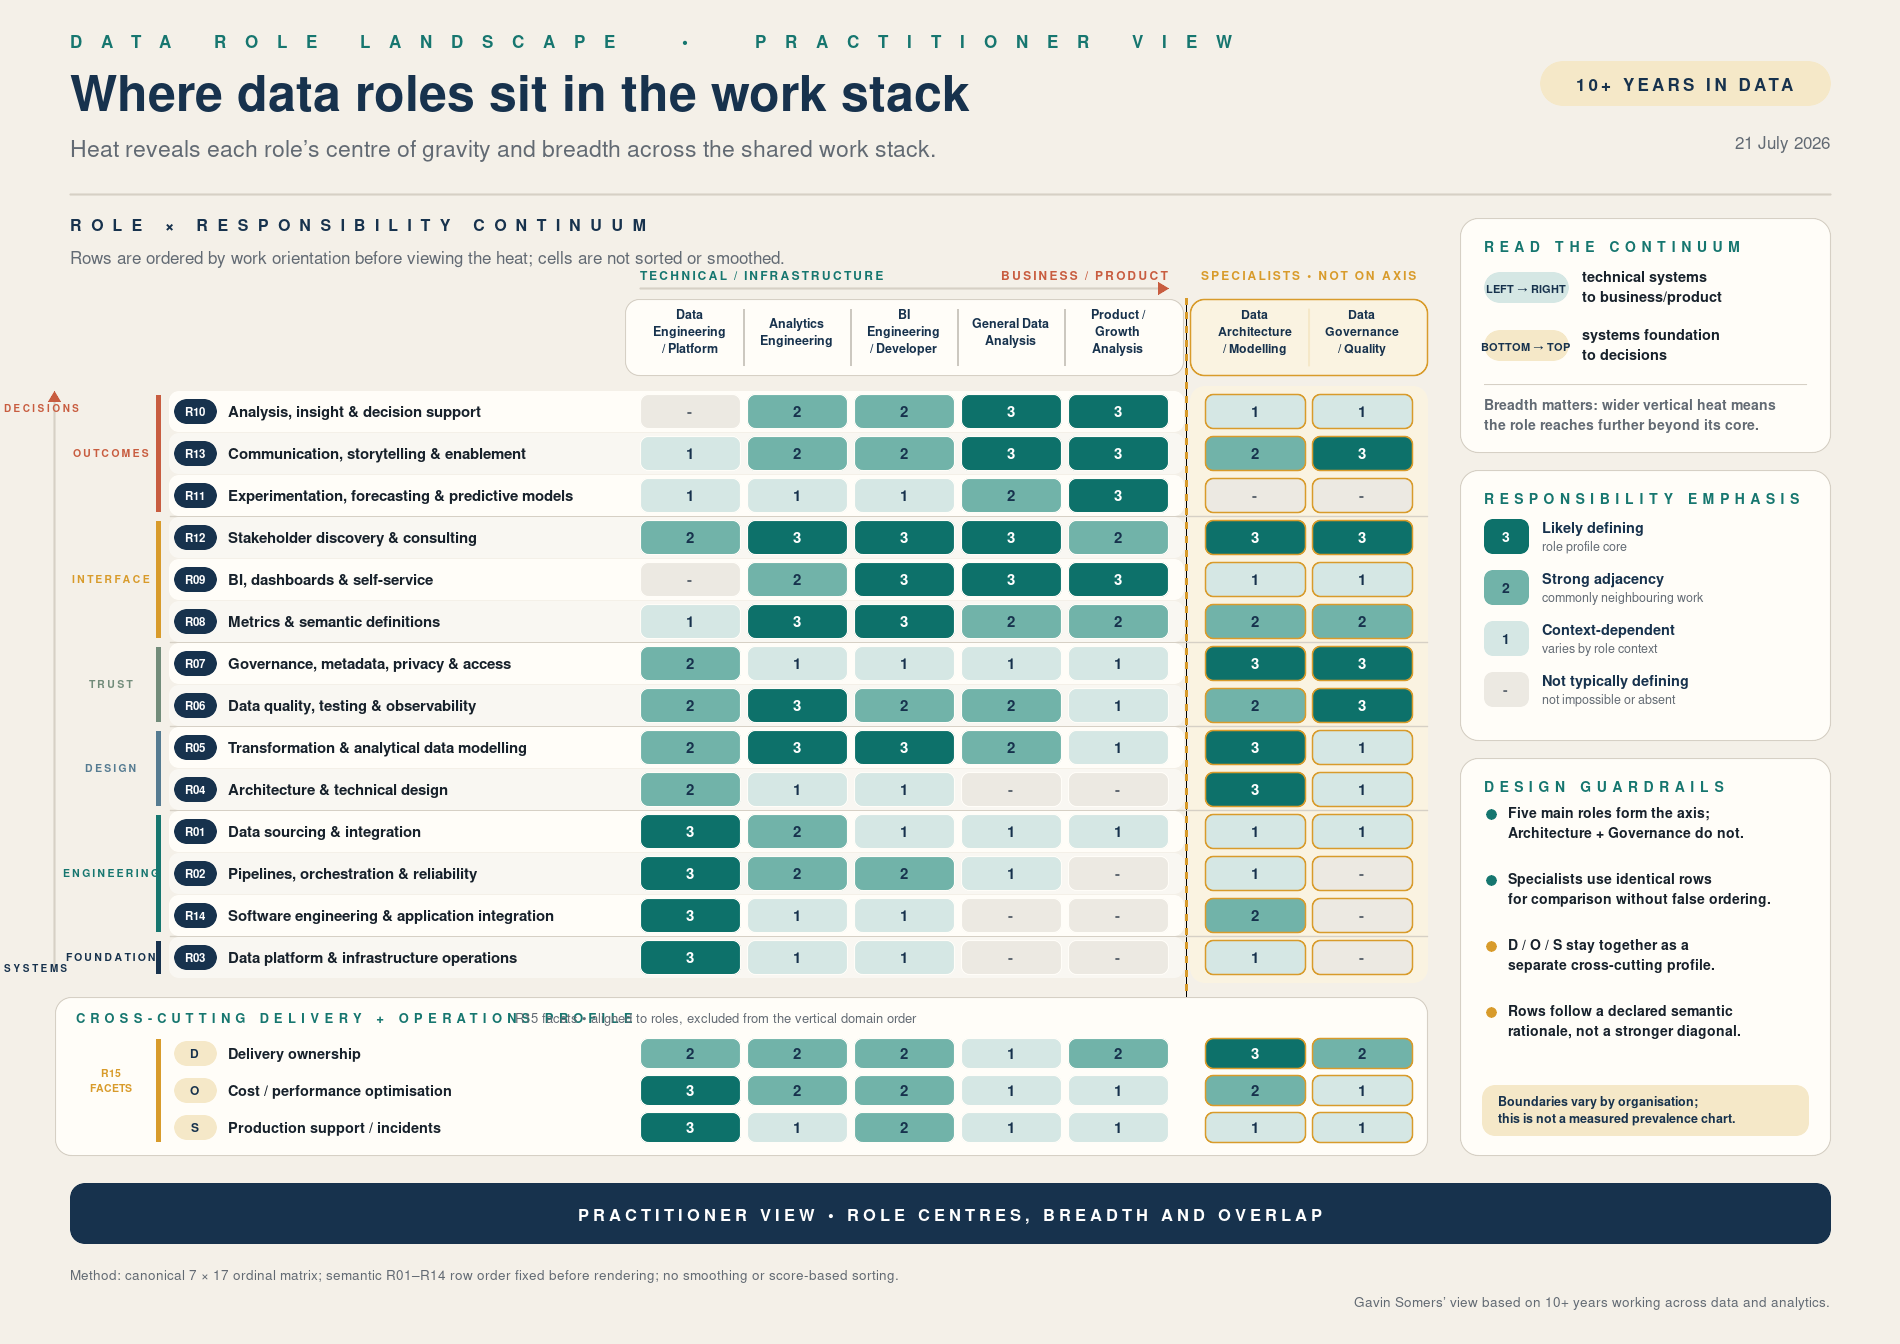
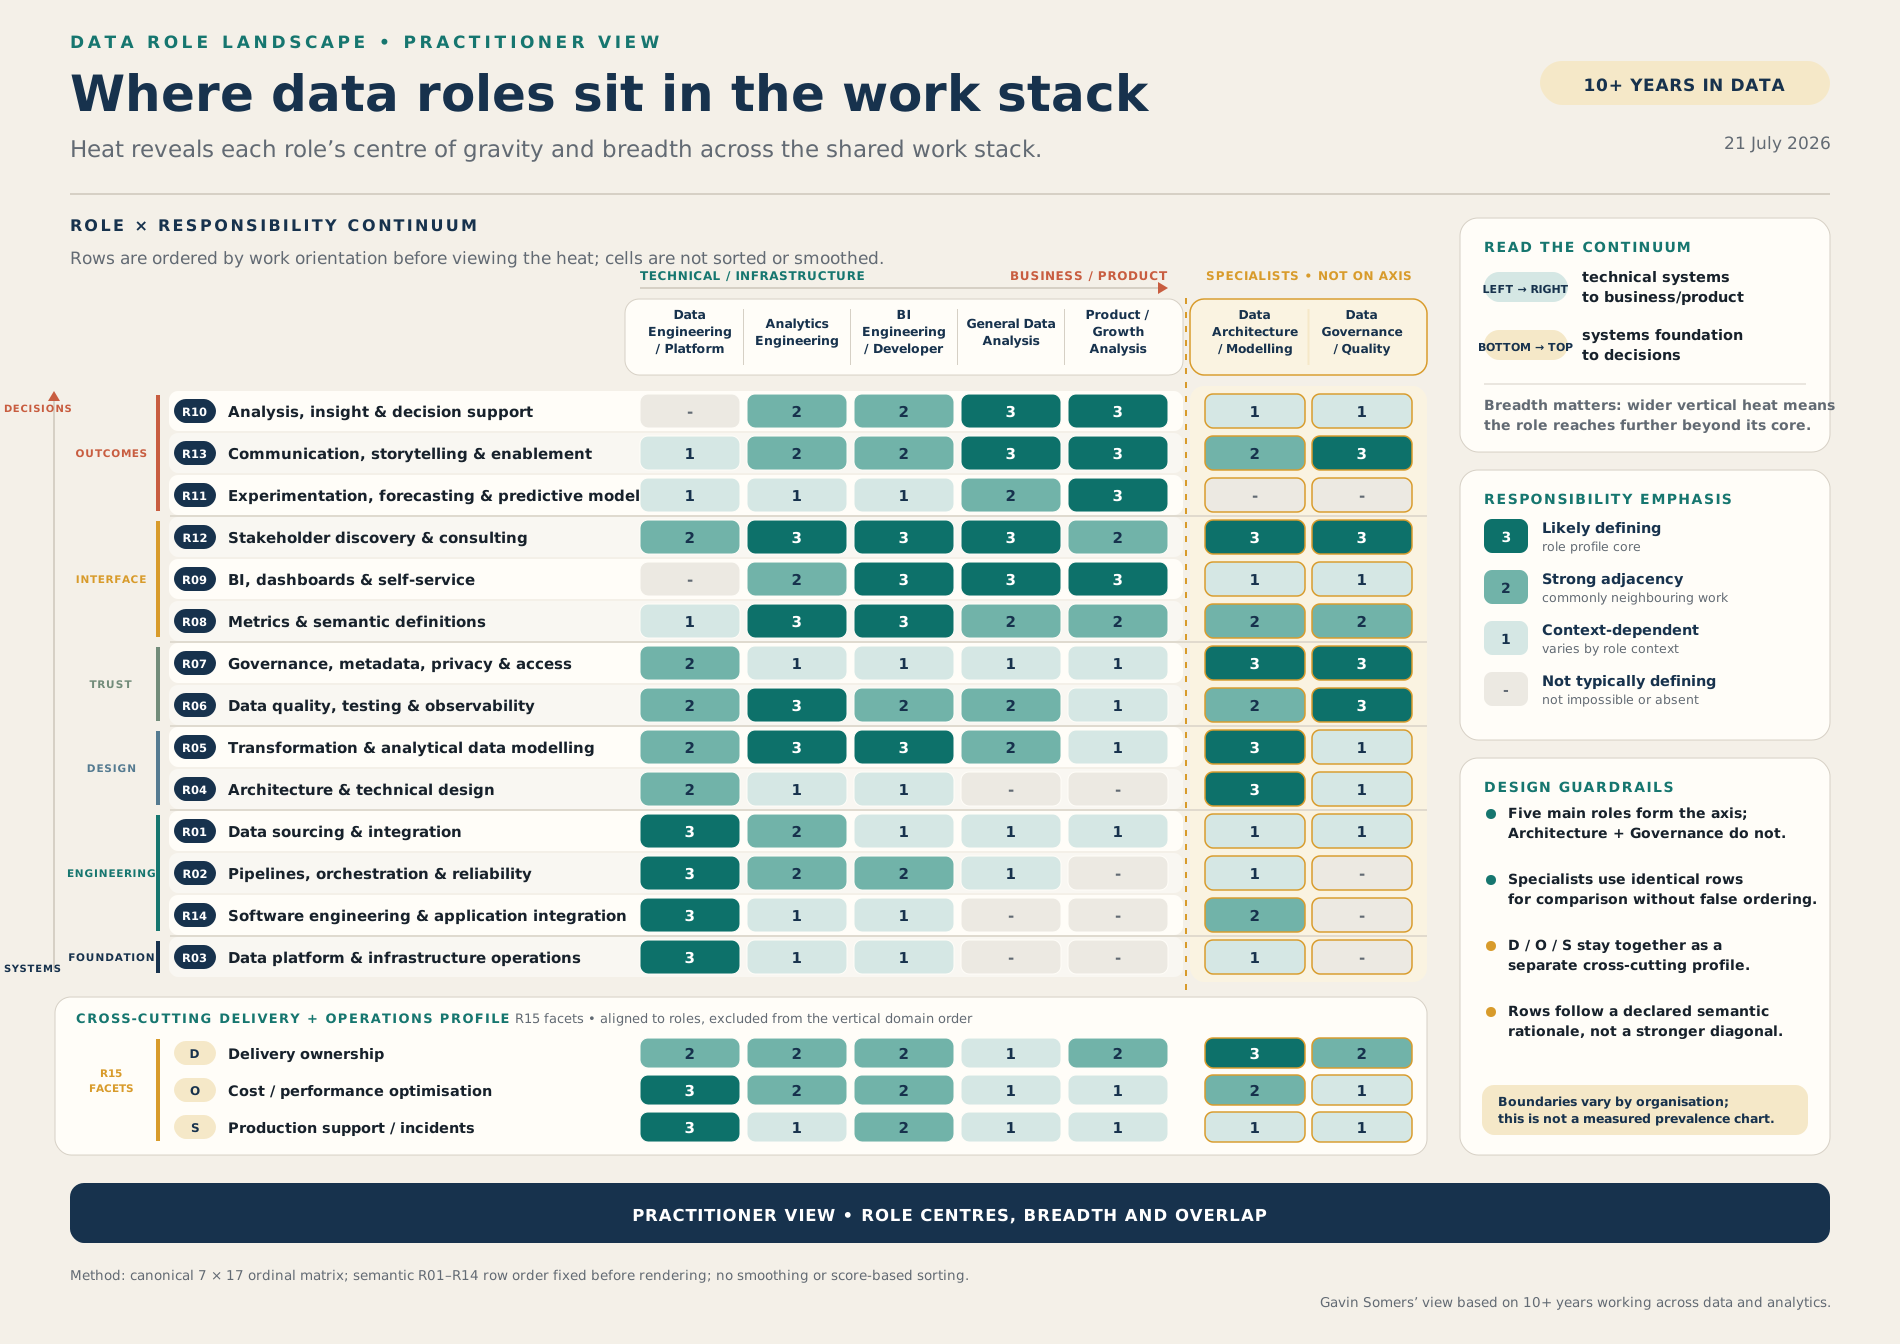
The matrix puts the roles across the top and a common set of responsibilities down the left. That makes the comparison more useful than seven separate job descriptions: you can see each role’s centre, its breadth and the places where adjacent roles overlap.
The five roles on the main axis move from technical infrastructure towards business and product analysis. Data Architecture and Data Governance sit beside them as specialist profiles, while delivery ownership, optimisation and production support remain in a separate cross-cutting strip underneath.
Why titles alone are a weak role contract
A platform name tells you where work happens. It does not tell you what the job is.
A “Snowflake Developer” might be building ingestion pipelines, writing analytical models, administering the platform, creating semantic definitions or supporting dashboards. Those responsibilities need different strengths, operating habits and measures of success even when they use the same technology.
Familiar role titles are not much safer. Data Engineers can model data. Analysts can build durable reporting assets. Analytics Engineers can work upstream on orchestration or downstream with stakeholders. BI Engineers often do substantial modelling and semantic work.
That overlap is not evidence that role definitions are pointless. It is evidence that exclusive lists are the wrong model.
A useful role contract needs to answer three questions:
- Which responsibilities should define this role?
- Which neighbouring responsibilities should it contribute to?
- Where do decision rights and operating expectations pass to another role?
The title can summarise those answers. It cannot replace them.
How to read the matrix
Across the top: the main role continuum
The five-role axis runs from more infrastructure and backend-oriented work towards more business and product-oriented analysis:
Data Engineering → Analytics Engineering → BI Engineering → General Data Analysis → Product/Growth Analysis
This is an orientation axis, not a hierarchy. Moving right does not mean becoming less technical. Moving left does not mean becoming more senior, more difficult or more valuable.
Down the left: a shared responsibility stack
The rows move from insight and decisions at the top towards systems foundations at the bottom. In order, they group:
- analysis, communication and experimentation;
- stakeholder discovery, BI products and metric definitions;
- governance and data quality;
- analytical modelling and technical architecture;
- sourcing, pipelines and software integration;
- data platform and infrastructure operations.
The order was chosen from that work orientation, rather than sorting the rows to create a tidier heat pattern. Governance, quality, metrics and stakeholder discovery remain visibly cross-cutting.
Inside each cell: responsibility emphasis
The detailed map uses four levels of emphasis:
- 3, likely defining: part of the role’s centre of gravity;
- 2, strong adjacency: commonly neighbouring work;
- 1, context-dependent: present in some organisations or team shapes;
- blank, not typically defining: not impossible and not necessarily absent.
The useful pattern is not any single cell. It is where the darkest cells concentrate and how far the surrounding work reaches.
The five-role shift in centre of gravity
Data Engineering and Platform
The darkest Data Engineering cells sit on sourcing and integration (R01), pipelines and reliability (R02), platform operations (R03) and software engineering (R14). Optimisation (O) and production support (S) are also defining in the cross-cutting profile.
That does not confine the role to moving data unchanged. Architecture, modelling, quality, governance and stakeholder discovery all remain adjacent. Transformation and analytical modelling (R05), for example, scores 2 rather than disappearing from the role. In smaller teams, that reach can be broad.
The distinction is emphasis: reliable data movement and systems operation are usually closer to the centre than dashboard delivery or direct decision support.
Analytics Engineering
Analytics Engineering’s defining cells are transformation and analytical modelling (R05), data quality and observability (R06), metrics and semantic definitions (R08), and stakeholder discovery (R12).
I see it as a bridge profile rather than a thin layer between engineering and BI. It carries engineering discipline into the logic that turns source data into reusable business meaning.
Its breadth is important. An Analytics Engineer may contribute to pipelines, optimisation, dashboards, analysis and communication without all of those responsibilities defining the role.
BI Engineering and Development
BI Engineering’s defining cells are analytical modelling (R05), metrics and semantic definitions (R08), BI and self-service (R09), and stakeholder discovery (R12). That creates strong overlap with Analytics Engineering, while moving the centre further towards reusable information products.
The difference is not “code versus visualisation”. Strong BI Engineering often includes substantial SQL, semantic modelling, testing, deployment and production support.
The clearer distinction is the product surface: BI Engineering usually concentrates more directly on governed information delivery to users.
General Data Analysis
General Data Analysis is darkest across BI and self-service (R09), analysis and decision support (R10), stakeholder discovery (R12), and communication and enablement (R13).
This does not make the role a passive consumer of prepared data. Analysts regularly contribute to modelling, quality, metric definitions and experimentation. The work becomes distinct through its stronger emphasis on interpreting evidence in context and helping people decide what to do.
A role specification that asks for extensive platform ownership and on-call support is therefore pulling away from this centre, whatever title sits at the top.
Product and Growth Analysis
Product and Growth Analysis is darkest across BI and self-service (R09), analysis and decision support (R10), experimentation and predictive methods (R11), and communication (R13). It shares three of those four defining areas with general analysis, but moves its centre further towards experimentation.
The boundary is relative rather than absolute. General analysts run experiments. Product analysts build reporting. Both may define metrics and work closely with stakeholders.
What changes is the repeated decision context: product behaviour, growth loops, customer journeys and measured interventions tend to carry more weight.
Architecture and Governance are specialists, not endpoints
Data Architecture and Data Governance use the same responsibility stack, but forcing them onto the five-role line would imply a false order.
They are better treated as specialist profiles that operate across the continuum.
Data Architecture and Modelling is darkest on technical architecture (R04), transformation and modelling (R05), governance (R07), stakeholder discovery (R12) and delivery ownership (D). It connects technical design to the organisational decisions that make the design usable.
Data Governance and Quality is darkest on data quality (R06), governance (R07), stakeholder discovery (R12) and communication and enablement (R13). The role is not only about writing policies. Effective governance requires consulting, enablement and enough delivery connection for controls to work in practice.
Specialist does not mean more senior. It does not mean above or below the main roles. It describes a different pattern of concentration across the same work.
Breadth and overlap matter as much as the centre
The most useful part of the landscape may be the shared territory.
Stakeholder discovery is connective tissue. It appears near the centre of Analytics Engineering, BI Engineering, General Data Analysis, Architecture and Governance, and it remains important to the roles on either side.
Modelling and metrics form a transition zone. They connect engineering systems to reusable business meaning, then connect that meaning to dashboards, analysis and decisions.
Communication is not an analyst-only responsibility. Architecture needs alignment. Governance needs adoption. Engineering roles need to explain constraints, trade-offs and incidents.
This is why “who owns data quality?” is often the wrong first question. Several roles may define, build, monitor, investigate or communicate quality in different ways.
Participation in a responsibility does not prove ownership of it. A sound team design makes the posture explicit: who defines the standard, who implements it, who operates it, who advises on it and who makes the boundary decision.
Keep cross-cutting operating expectations visible
Delivery ownership (D), cost and performance optimisation (O), and production support (S) cut across the domain responsibilities.
They deserve to be specified separately because two jobs can have similar technical subject matter and very different operating contracts.
For example, a BI Engineer who builds and supports a production semantic layer has a different role from someone who creates one-off dashboards, even if both job descriptions mention SQL, metrics and visualisation.
The same applies to an analyst expected to own a recurring decision product, or an architect expected to direct delivery rather than only produce designs.
Separating these expectations prevents a generic phrase such as “end-to-end ownership” from hiding three different commitments.
A practical role-specification test
Use the landscape to make a hiring or team-design conversation concrete:
- Choose three to five defining responsibilities. These should describe the role’s centre of gravity.
- Mark the adjacent work. State what the person contributes to without implying that every neighbouring responsibility is core.
- Name the boundary decisions. Say which role decides when responsibilities overlap or priorities conflict.
- Specify the operating contract. Treat delivery ownership, optimisation and production support as explicit expectations.
- Remove the title and reread the profile. Ask where its responsibility heat would actually land.
If the answer conflicts with the title, change the title or change the scope.
That is especially important when a specification quietly combines platform engineering, analytics modelling, dashboard delivery, ad hoc analysis and stakeholder consulting into one supposedly standard role.
A broad role can be legitimate. An accidental role is the problem.
What not to infer from the map
This landscape is not:
- a career ladder;
- a measure of seniority, value or technical difficulty;
- a claim that work outside a role’s centre is absent;
- proof that one role exclusively owns a responsibility.
It is a way to describe typical centres and overlaps clearly enough for teams to challenge them.
After more than ten years across data and analytics, this is the map I would use to start that conversation today.
Do other practitioners see the landscape similarly, or would you place the centres, breadth or specialist boundaries differently?